
Investors Club provides a structured marketplace for buying and selling online businesses. Our listings compile data from multiple sources, and our due diligence reports help you identify discrepancies, benchmark valuations, and prepare the right questions before making an offer.
This guide explains where listing data comes from, what our due diligence reports analyze, and how to use them effectively.
The Two Types of Listings
Every listing on Investors Club falls into one of two categories:
For Sale by Owner
The seller lists and manages the sale directly. All figures, financials, descriptions, and claims come from the seller. Investors Club does not verify revenue, profit, or other financial assertions.
Managed by Broker
A broker represents the seller. Many buyers assume broker involvement means thorough verification has occurred. This is usually not the case.
As one broker describes their process: “We conduct only surface-level due diligence; buyers must complete their own before making an offer or bid.”
Brokers typically confirm basic details—the business exists, the seller owns it—but do not independently verify revenue figures, profit margins, or traffic claims.
Regardless of listing type, financial verification is entirely your responsibility as the buyer.
What Investors Club Independently Collects
These data points are gathered by our team:
Domain Metrics
We pull domain authority and SEO metrics from industry-standard tools:
| Metric | Source | What It Measures |
| Domain Rating | Ahrefs | Link popularity compared to other websites |
| Domain Authority | Moz | Predicted ability to rank in search results |
| SemRush Score | SemRush | Overall domain strength |
| Linking Root Domains | Multiple | Number of unique domains linking to the site |
| Total Backlinks | Multiple | Total inbound links |
| Total Keywords | SemRush | Keywords the domain ranks for |
| Indexed Pages | Pages indexed by search engines |
These metrics provide an objective snapshot of domain strength and SEO health.
Verified Traffic Data (When Available)
When a seller connects their Google Analytics, we pull traffic data directly. Examples of verified data include monthly sessions, traffic sources, geographic breakdown, and top pages—though exact metrics vary by listing.
Important: Not all sellers provide Google Analytics access. When they don’t, no verified traffic data appears in the listing.
Price History and Listing History
We track the “first seen” date for every business and maintain history from that point forward. If a business was previously listed, sold, and is now being resold by a different owner, you’ll see the full pricing history for that business on a listing.
What Sellers Provide
The following data comes directly from sellers, and Investors Club does not verify these claims:
Financial Data
- Revenue figures (monthly and annual)
- Profit figures (monthly and annual)
- Expense breakdowns
- P&L statements
- Revenue screenshots
Business Description
All narrative content—business history, operations overview, growth opportunities, reason for selling—is written by the seller.
Traffic Source Claims
When sellers indicate their “main traffic sources” (SEO, Pinterest, paid ads, etc.), this is self-reported.
Team Size
“Team” might mean employees, contractors, freelancers, or just the owner. Don’t assume specific labor costs based on this field before confirming what the “team” means.
What Our Due Diligence Reports Analyze
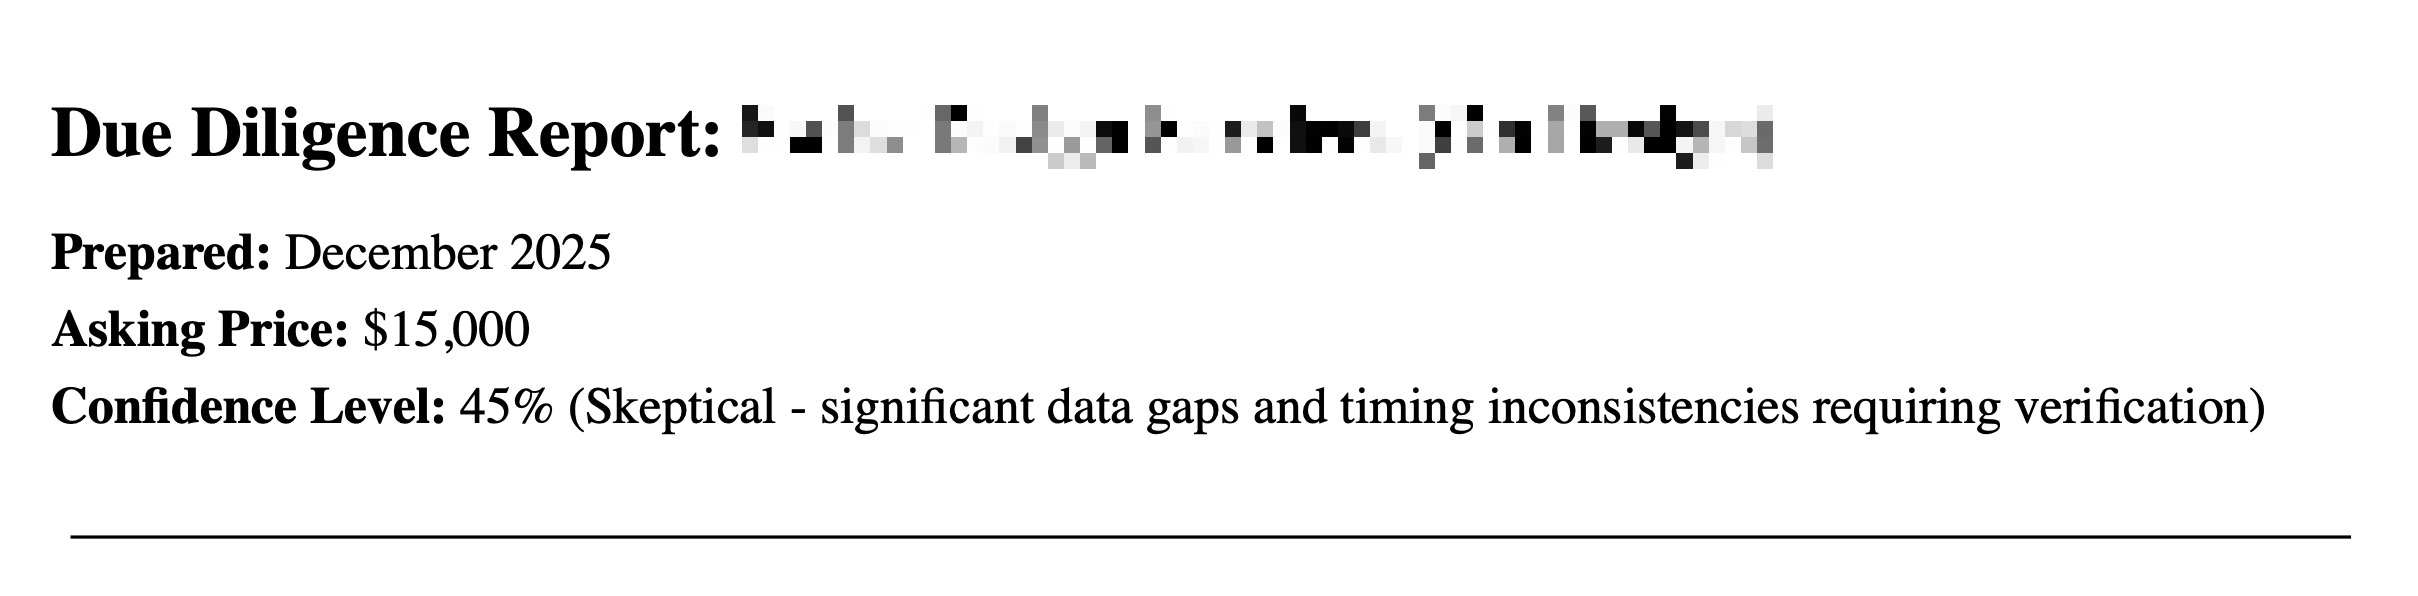
Our due diligence reports don’t verify seller claims—that remains your job. What they do is systematically analyze the available data to surface discrepancies, benchmark against industry standards, flag potential concerns, and give you the right questions to ask.
Cross-Referencing Data Sources
We compare figures across every available source in the listing:
- Headline claims vs. financial tables
- P&L statements vs. provided monthly data
- Revenue screenshots vs. reported figures
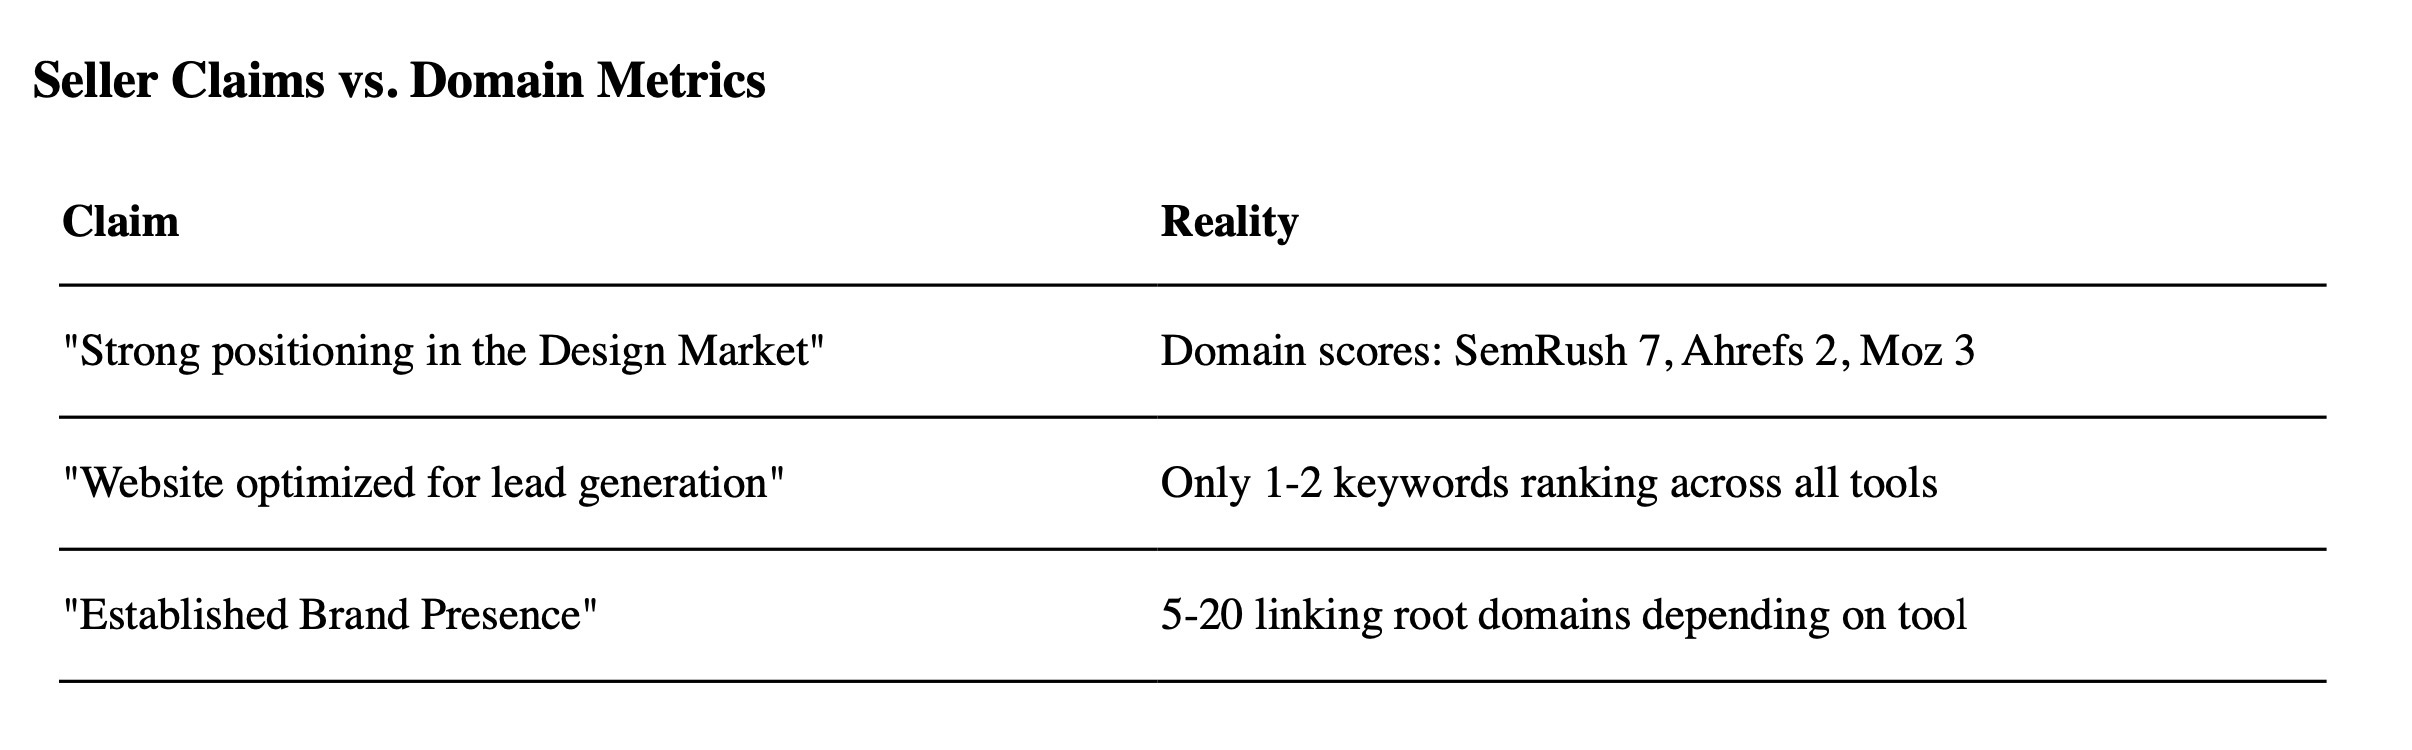
- Seller narrative vs. metrics
- Any uploaded documents vs. other claims
When numbers don’t match, we flag it. Even small discrepancies (over 5%) are noted, because patterns of inconsistency matter.
Benchmarking Against Industry Standards
Every asking price is compared against typical valuation ranges for similar businesses:
| Business Type | Typical Profit Multiple |
| Micro e-commerce (<$5K profit) | 0.5–1.5x |
| Small e-commerce ($5K–50K profit) | 1.5–2.5x |
| Established e-commerce (>$50K profit) | 2–3.5x |
| Content sites | 2–4x |
| SaaS | 3–5x ARR |
A listing priced well above these ranges isn’t automatically bad—but it requires justification.
Financial Analysis
We calculate profitability ratios and compare them against benchmarks for the business type:
- Profit margin (and whether it’s realistic for the model)
- Revenue and profit trends over available months
- Seasonality patterns
- Month-over-month consistency or volatility
Each metric is shown alongside a benchmark range and flagged as “Good” or “Concern.” If margins seem implausible or trends show unexplained drops, it’s called out here.
Data Discrepancies Identified
When we find mismatches, the report presents them clearly in a comparison table—showing the value from each source and the percentage difference. For example, if a P&L shows $12,000 annual revenue but the monthly financial table totals $10,500, that’s a 14% discrepancy that gets flagged with both figures side by side.
Flagging Issues by Severity
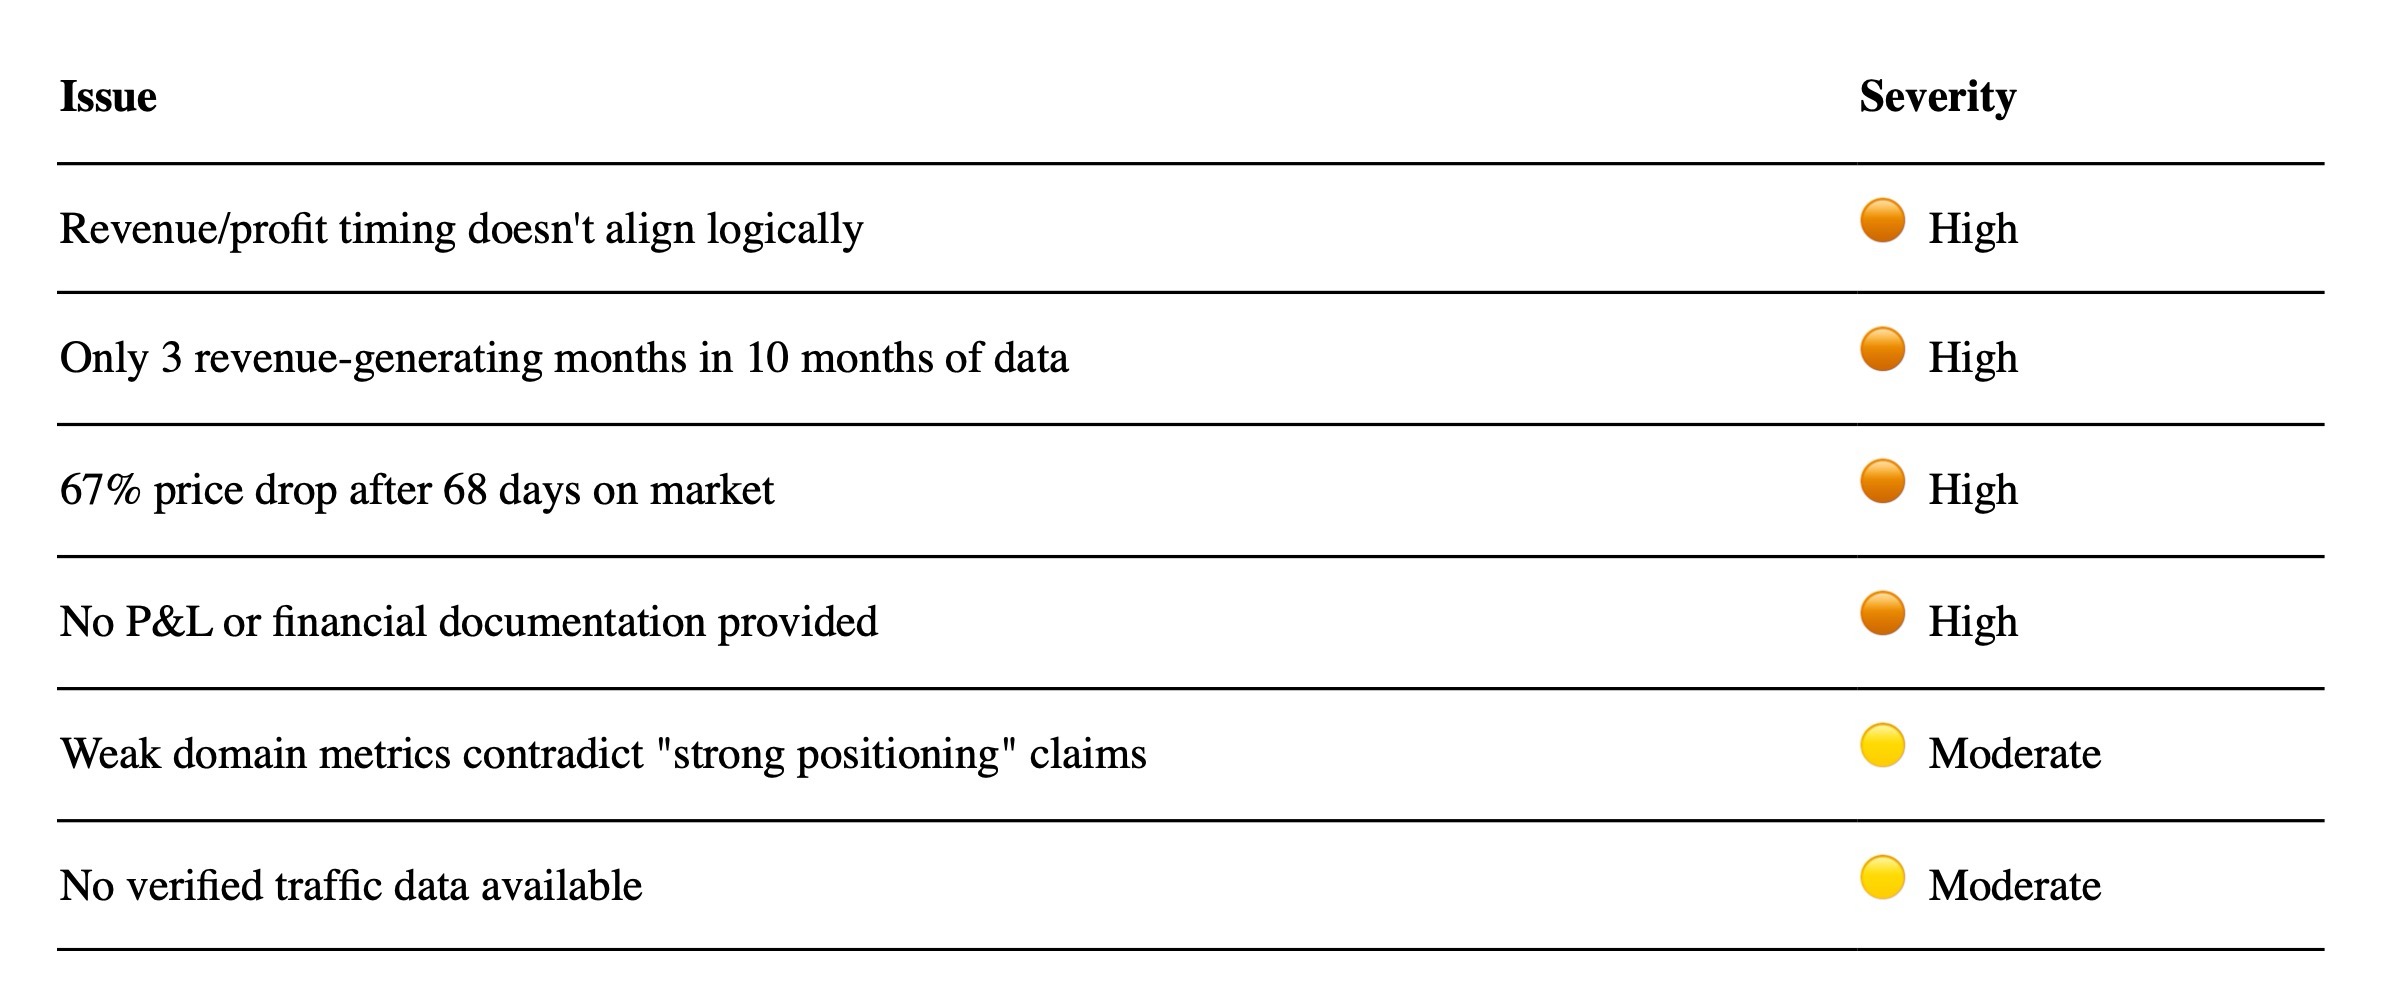
We group all identified issues into a dedicated Red Flags section, organized by severity (Critical → High → Moderate), each with a brief explanation of why it matters.
🔴 Critical — Must be resolved before proceeding
- Data doesn’t match between sources
- Timeline claims don’t add up
- Core claims are unverifiable
🟠 High Severity — Significant concerns
- No traffic verification available
- Declining revenue trends
- Heavy platform or supplier dependency
🟡 Moderate — Worth noting
- Premium pricing for size/stage
- Seller motivation unclear
- Minor inconsistencies
Valuation Scenarios
We model multiple scenarios to show the range of reasonable values:
| Scenario | Approach |
| Pessimistic | Conservative multiple based on concerns identified |
| Base Case | Fair multiple given business type and data quality |
| Asking Price | What multiple the seller is requesting |
This gives you a recommended offer range based on the analysis.
Payback Analysis
How long would it take to recover your investment? We calculate payback periods under optimistic, realistic, and pessimistic assumptions based on the reported monthly profit.
Fair Value Estimate
The section calculates a valuation range using different multiples:
| Scenario | What It Represents |
| Pessimistic | Lower multiple reflecting identified risks |
| Base Case | Reasonable multiple given business quality |
| Asking Price | The multiple implied by seller’s price |
This produces a recommended offer range—the floor and ceiling we’d consider reasonable given the analysis.
Questions for the Seller
Every report includes 12–15 targeted questions organized by category:
Financial Verification
- Explain any data discrepancies identified
- Provide access to payment processor records
- Clarify gaps in financial history
Traffic & Marketing
- Provide Google Analytics access
- Break down customer acquisition costs
- Explain traffic source sustainability
Operations
- Detail supplier relationships and terms
- Provide return/chargeback rates
- Clarify actual time commitment required
Strategic
- True reason for selling
- Biggest challenges facing the business
- Realistic growth opportunities
These aren’t generic questions—they’re generated based on the specific issues found in that listing.
How to Use Due Diligence Reports
The report gives you a structured starting point:
- Review the severity flags — Critical issues need answers before you go further
- Check the discrepancies — Understand where the numbers don’t align
- Consider the valuation analysis — Is the asking price justified by the data?
- Use the questions — These are designed to surface the information you still need
The report tells you what to investigate. The actual verification—reviewing bank statements, accessing analytics, confirming operations—happens in your conversations with the seller.
Questions?
If you’re evaluating a listing and want to understand the data better, reach out to our team. We’re happy to clarify what information is available and help you connect with sellers.
This article reflects Investors Club’s current listing format and due diligence reports as of 2025.


Aaron Dwyer
January 31, 2023 at 7:33 amJust started looking into investors club. This was a good round up for me. Thanks